
I love to root for the underdog.

Boring seasons of The Amazing Race are those wherein a single team steamrolls their way to victory. Fortunately, the last two seasons of the show saw underdogs winning the million-dollar prize. Brooke and Scott and Dana and Matt obviously didn’t dominate the race, but they managed to pull it off at the very last minute.
By underdog, I mean a team that didn’t perform excellently throughout the race, always having a low placing in the checkin mat, but nevertheless managed to reach the last leg. On the other hand, a dominant team is one that performs consistently well throughout the race.
In this post, there are two things I want to answer:
- Do underdogs often win?
- Who are the most dominant teams in all seasons of the show?
I don’t want to put any of my biases in the analysis since Reddit would be the right place for that. I’m going to move forward with a data-driven approach by considering all contestants and their leg placement tables to answer the two questions.
Some Operational Definitions
Since we’re using a data-driven approach, we have to operationally define what underdog and domination are.
Domination Index
To tie together the concepts of underdog and domination, I introduce a simple index, the aptly-named domination index.
Intuitively, when one thinks of a domination index of a TAR team, he would probabily say that it should be an average of the placement of a team in every leg that the team participated in. However, to be able to compute the average fairly, the placements in each leg must be in similar scales, with the number of teams participating factored out.
For illustration, consider legs 1 and 6 of TAR 29. On leg 1, there were 11 teams in the running, so the placements ranged from 1 to 11. On leg 6, only seven teams remained, so the placements went from 1 to 7. As a specific example, remember that Brooke and Scott placed 4 out of 11 on leg 1 and 5 out of 6 on leg 7. It seems incorrect to add 4 and 5 directly since the two legs had different numbers of teams still participating. So how can we put the placements in similar scales?
By normalizing the scores based on how many teams are left in the respective leg. This would put each leg’s placement in a scale from 0 to 1, thereby allowing us to take averages irrespective of the number of teams remaining in each leg.
Let us define the performance index of a TAR team on leg j as
Intuitively, we can think of the performance index of a team in a leg as the fraction of the other teams that placed lower in the particular leg. A team with a performance index of 0 is the last team: 0% of other teams placed lower. A team with a performance index of 1 is the first placer: 100% of other teams placed lower.
In general, a team with a performance index of x on leg j means 100x% of other teams placed lower on leg j. Now that the placements of the different legs are comparable, we can now talk about averaging the placements.
We can now define the domination index as a rolling average of the performance index across the different legs. For a specific team, we compute the domination index on leg j as
Intuitively, a team’s domination index on leg j is a measure of the team’s performance from leg 1 up to leg j. If a team had a domination index of 0.4 on leg 6, then it means that, on average, 40% of the team’s competitors placed lower than the team on legs 1 to 6.
Since the domination index is a function of the leg, we can explore its time dynamics for each team in the race.
Underdog Team
Using the domination index, we can operationally define what an underdog is. Let K > 0 be a threshold. Then a team with a final domination index lower than K gets classified as an underdog, while a team with a domination index higher than K gets classified as a dominant team.
For all that follows, I set the threshold to 0.6, which means that a team is dominant if, on average, it places higher than 60% of the other teams. This is purely a subjective criterion which I based on the domination distribution across all finalists in the 29 seasons. In terms of Season 29, Tara and Joey get classified as a dominant team, while Brooke and Scott and London and Logan do not.
Season 29: A Case Study in Domination
Just to reinforce the intuition of the domination index, let us consider season 29 as a concrete example and uncover the domination dynamics of all participating teams.
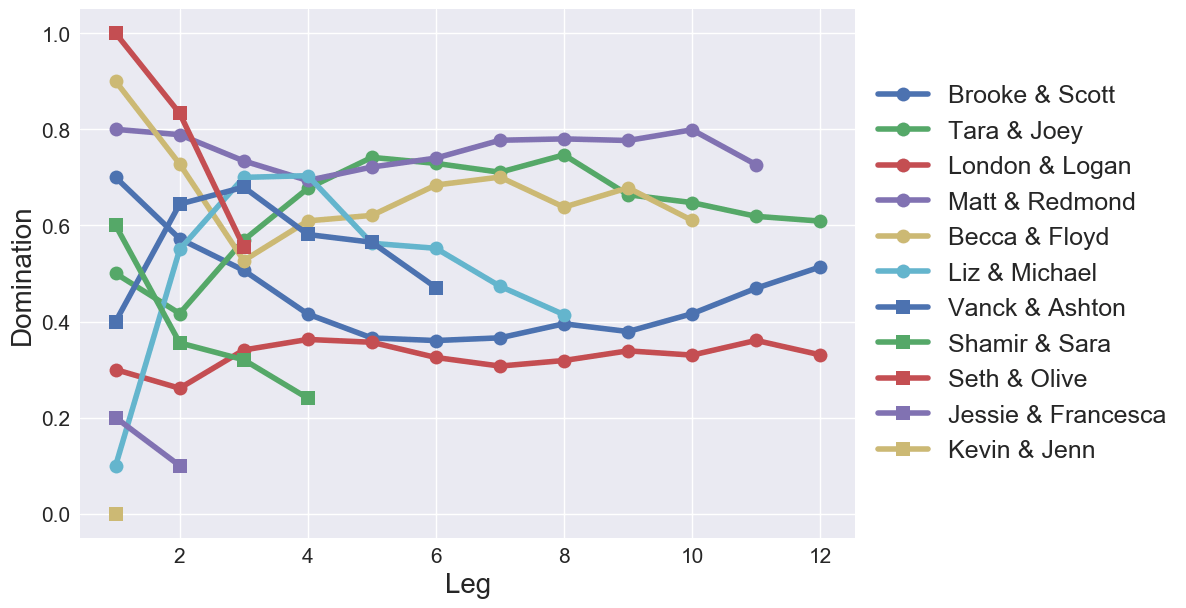
As we can see here, Kevin and Jenn only have a domination index on leg 1 since they were the first ones out. Obviously, it’s 0 because they placed last.

On the other end of the spectrum, only Brooke and Scott, Tara and Joey, and London and Logan have domination indices from legs 1 to 12, since they’re the only teams that actually completed the race.
Seth and Olive started out so high, with a domination index of 1, then sizzled out at leg 3 wherein they were U-turned by Tara and Joey. Liz and Michael and Vanck and Ashton have downward parabolic trends, starting out quite rocky, then finding their footing, and then eventually doing badly again. It’s important to note that all three teams I mentioned here got U-turned. This hints that doing great in the first few legs isn’t a particularly good strategy since it puts a target on your back.
Matt and Redmond and London and Logan display flat domination dynamics. The first team is a steady 0.7–0.8, while the latter is a steady 0.3. The ironic thing is that London and Logan were the ones that got to the finale, even if they performed quite poorly throughout the race. It just proves that you don’t have to be a dominating force in the race to get to the end — you just have to make sure that someone is behind you at all times.

Interestingly, only Brooke and Scott display an upward parabolic trend — starting out really well, doing not so well in the mid-race, then finishing out with a bang. The dynamics in their domination index sets up a good winner’s story.
And with that, let’s do a ranking of the teams according to their final domination index.
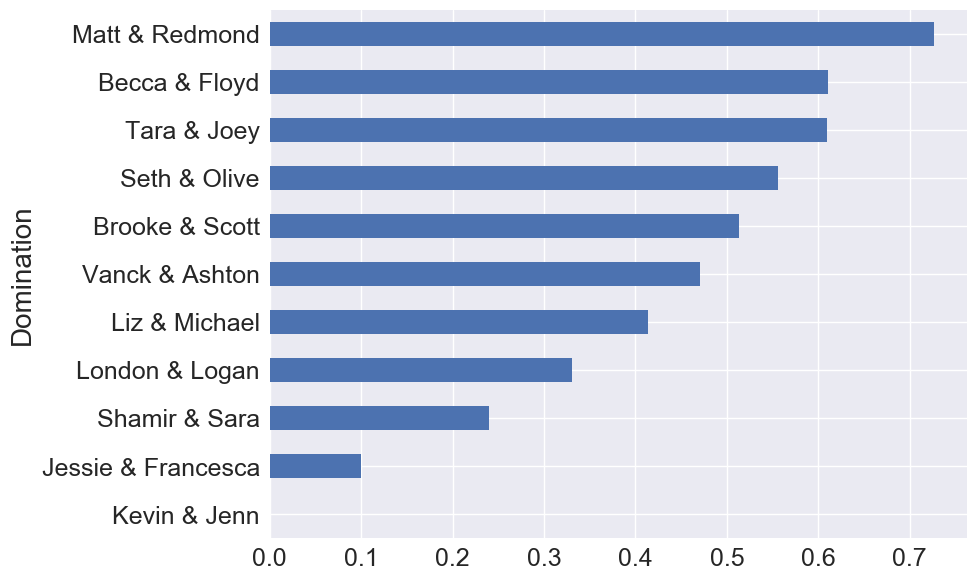
With a large margin, Matt and Redmond dominated the race. They have a final domination score well above 0.7, which means that they placed above >70% of team throughout the race. Becca and Floyd and Tara and Joey are second and third, with the first team edging the second by a very, very small margin.
Seth and Olive appear quite high, which is interesting since they were eliminated third in the race. They placed really high on the first two legs, but got U-turned on the third which led to their elimination. This just proves that Seth and Olive are really strong racers, and a definite threat to win if they weren’t targeted early on.
Winners Brooke and Scott are at fifth place while the third-placers London and Logan are fourth from the bottom, which again prove that you don’t have to dominate the race to get to the end. It’s important to point out that these two teams were in an alliance throughout the race.
Finale Underdog Analytics
Now let’s go back to business and answer the first question we posted at the beginning: Do underdogs often win?
Top Three
We first look at the distribution of underdog and dominant teams constituting the top 3 in the 29 seasons of the show.
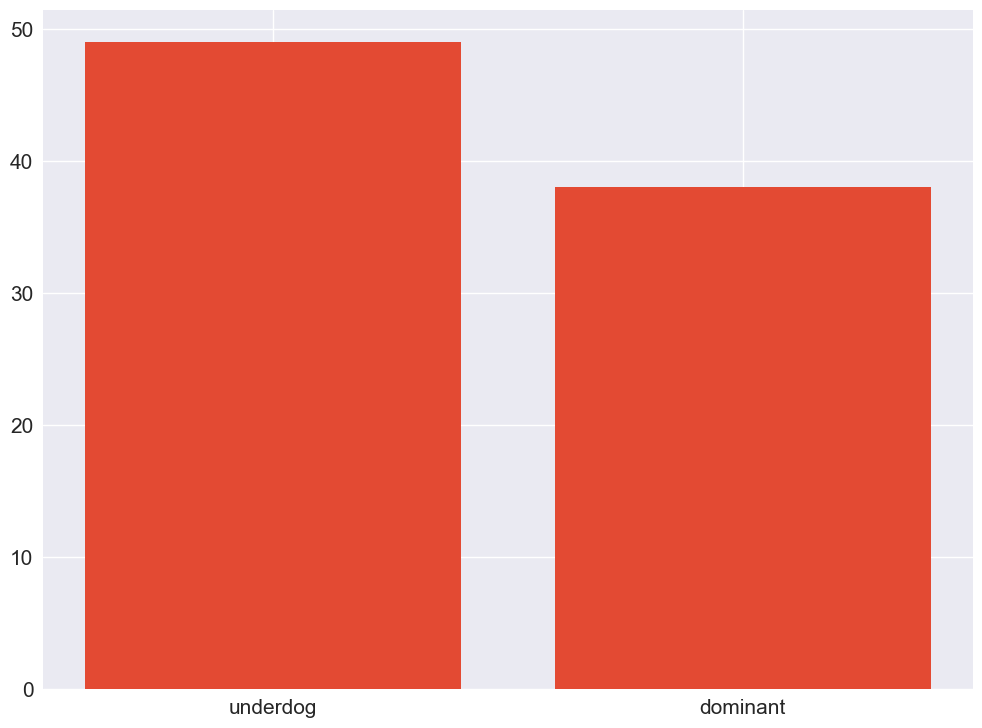
Underdogs edge out dominant teams in number in the final leg. A more interesting thing to look at is the constituency of the top 3 teams.
How many dominant teams are there in the top 3 for each season?
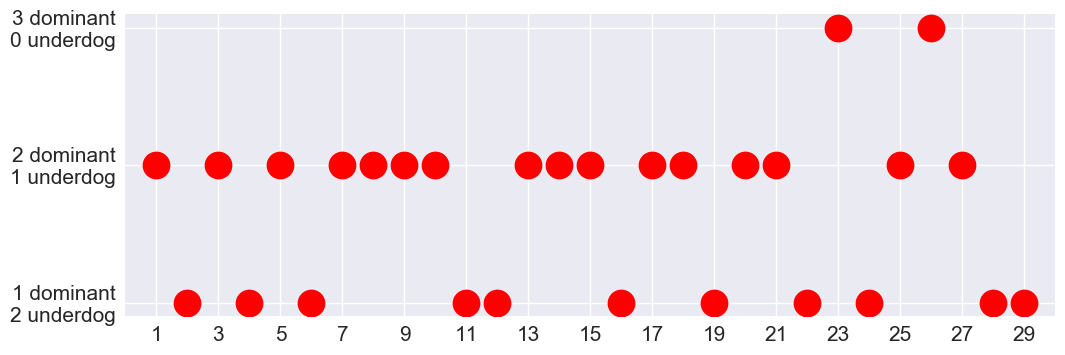
We see here that only Seasons 23 and 26 had a top 3 which included all dominant teams. Season 26 is the Blind Dating vs. Currently Dating season, and all three teams in top 3 were indeed quite strong. If fourth-placers Mike and Rochelle (underdogs) were able to outlast another team in the top 3, then only Season 23 would have had the distinction of a top 3 of dominant teams.
The last two seasons of the show had a top 3 of two underdogs and one dominant team. It’s interesting to point out that stronger teams were eliminated in the 4th and 5th places on these seasons. Surely, luck plays a central role in reaching the top 3, not just pure racing skill.
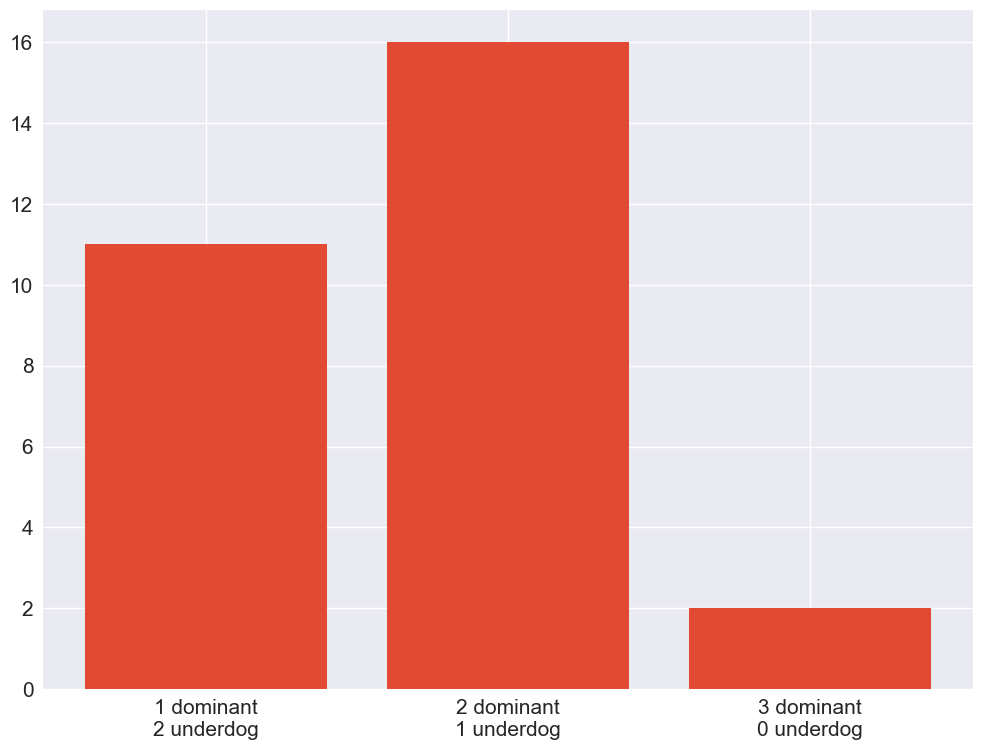
Looking at the distribution of team constituency, the most common occurrence is a top 3 of two dominant teams and one underdog team, followed by one dominant and two underdog. A far third is the three dominant team case.
I have to point out that there hasn’t been an instance of three underdog teams in the final leg. Boy, wouldn’t that be interesting to watch. If that were the case, however, and if all teams were underdogs, wouldn’t that mean that no one is an underdog?
Winners
Let’s now answer the question of whether underdog teams often win.
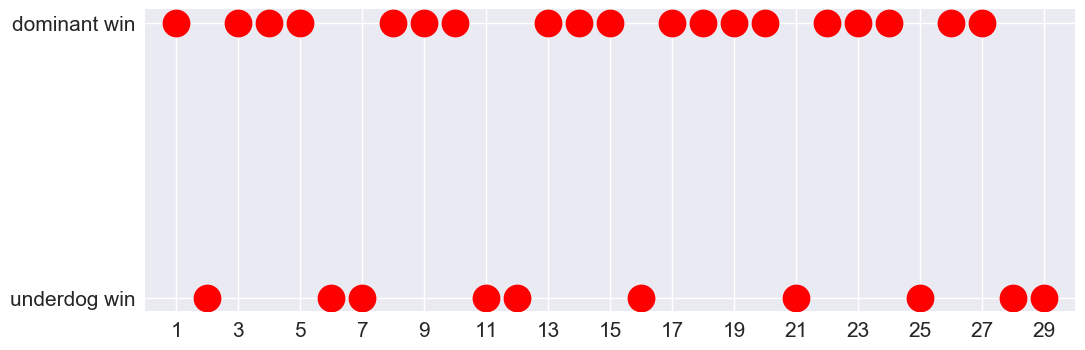
We see that when dominant wins occur, they tend to occur one after the other. Underdog wins happen only once in a while. That’s probably why they’re so exciting to watch.
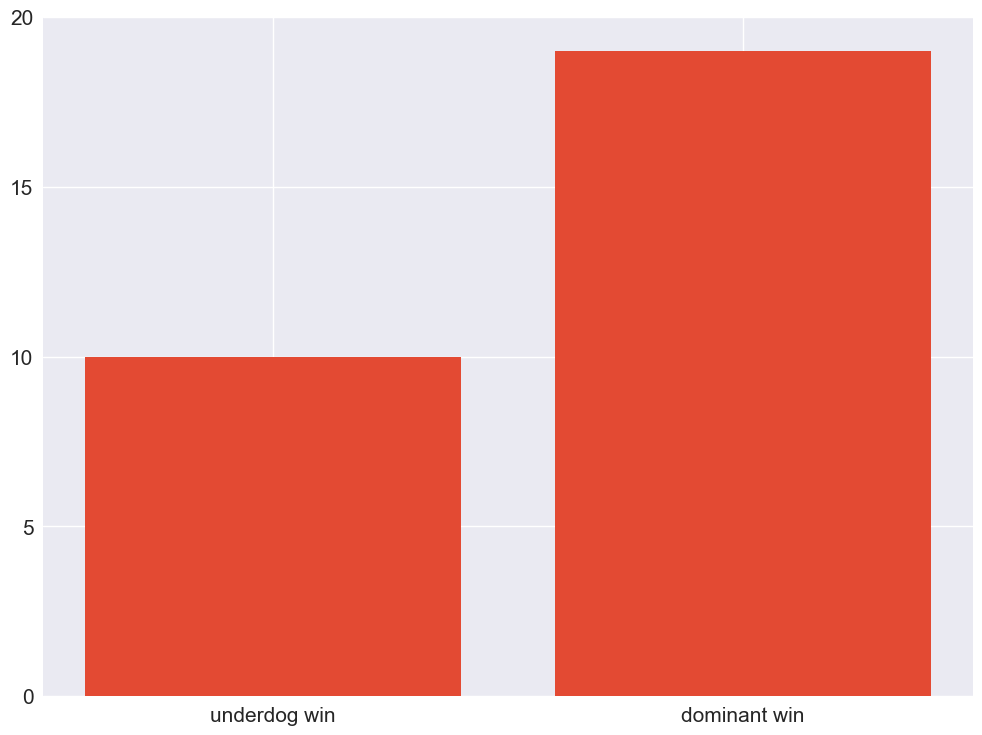
A dominant team winning happens almost twice as often as an underdog team winning.
I’m a fan of underdog wins. It’s quite boring to see a team be dominant the whole race and basically steamroll to the end. An out-of-the-left-field win is much more interesting. That’s probably why I liked the Brooke and Scott win at the end of 29 (though I hated the Dana and Matt win of 28). For me, it boils down to personality as well, and although I found Brooke to be very annoying, Dana was flat-out abusive. I really wish Sheri and Cole won 28.
Most Dominant Teams of the Series
Now let us focus on the second question: Who is the most dominant team across all seasons of The Amazing Race?
To be honest, this question isn’t really difficult to answer. With a staggering eight legs won, Rachel and Dave definitely take the cake. However, which one is second, third, fourth? Among all winners or finalists, which teams belong to the top 10 most dominant?
In this section, we’ll answer all these questions. We’ll look at the domination index of every team that reached the final leg of their respective season. In the process, we will be able to determine which teams dominated the race and which ones just got a lucky break at the end.
At the end of the post, we will also look at the top 50 most dominant racers in Amazing Race history, regardless of placement.
In the following, we compute the domination index of a team based on the last leg that the teams participated in. So for the finalists, it’s the last leg; for the non-finalists, it’s the leg that they were eliminated on.
Winners
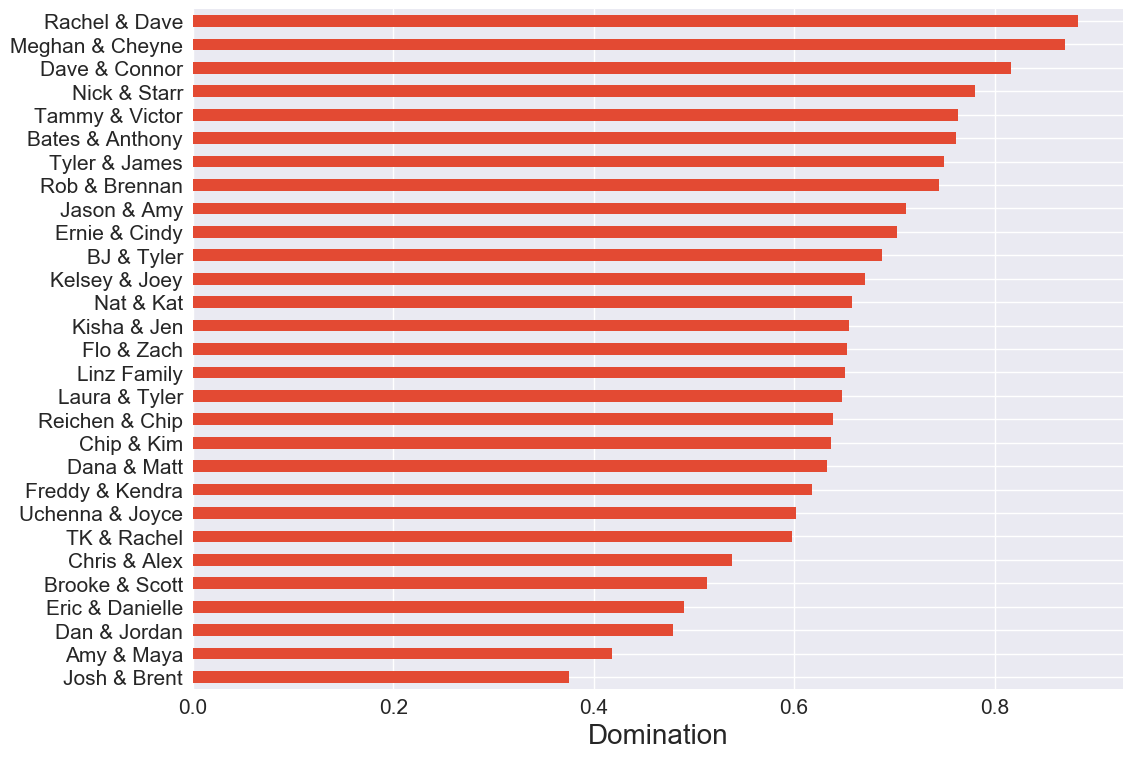
In terms of winners, Rachel and Dave takes the top spot, followed quite closely by Meghan and Cheyne, who won seven legs, one less than Rachel and Dave. Season 24 winners Dave and Connor are third. The top three all surpassed the 0.8 level of domination, which means that, on average, they placed 80% higher than other teams on the race.
On the other side of the spectrum, Josh and Brent have the lowest domination index, not even reaching the 0.4 mark. Interestingly, the four most recent winners of the show all rank in the lower half of winners in terms of domination.
Finalists
If we now include in our roster the other teams who participated in the final leg (that is, second and third placers), we obtain the plot below. The bars are color-coded such that the darker the shade, the higher the placement.
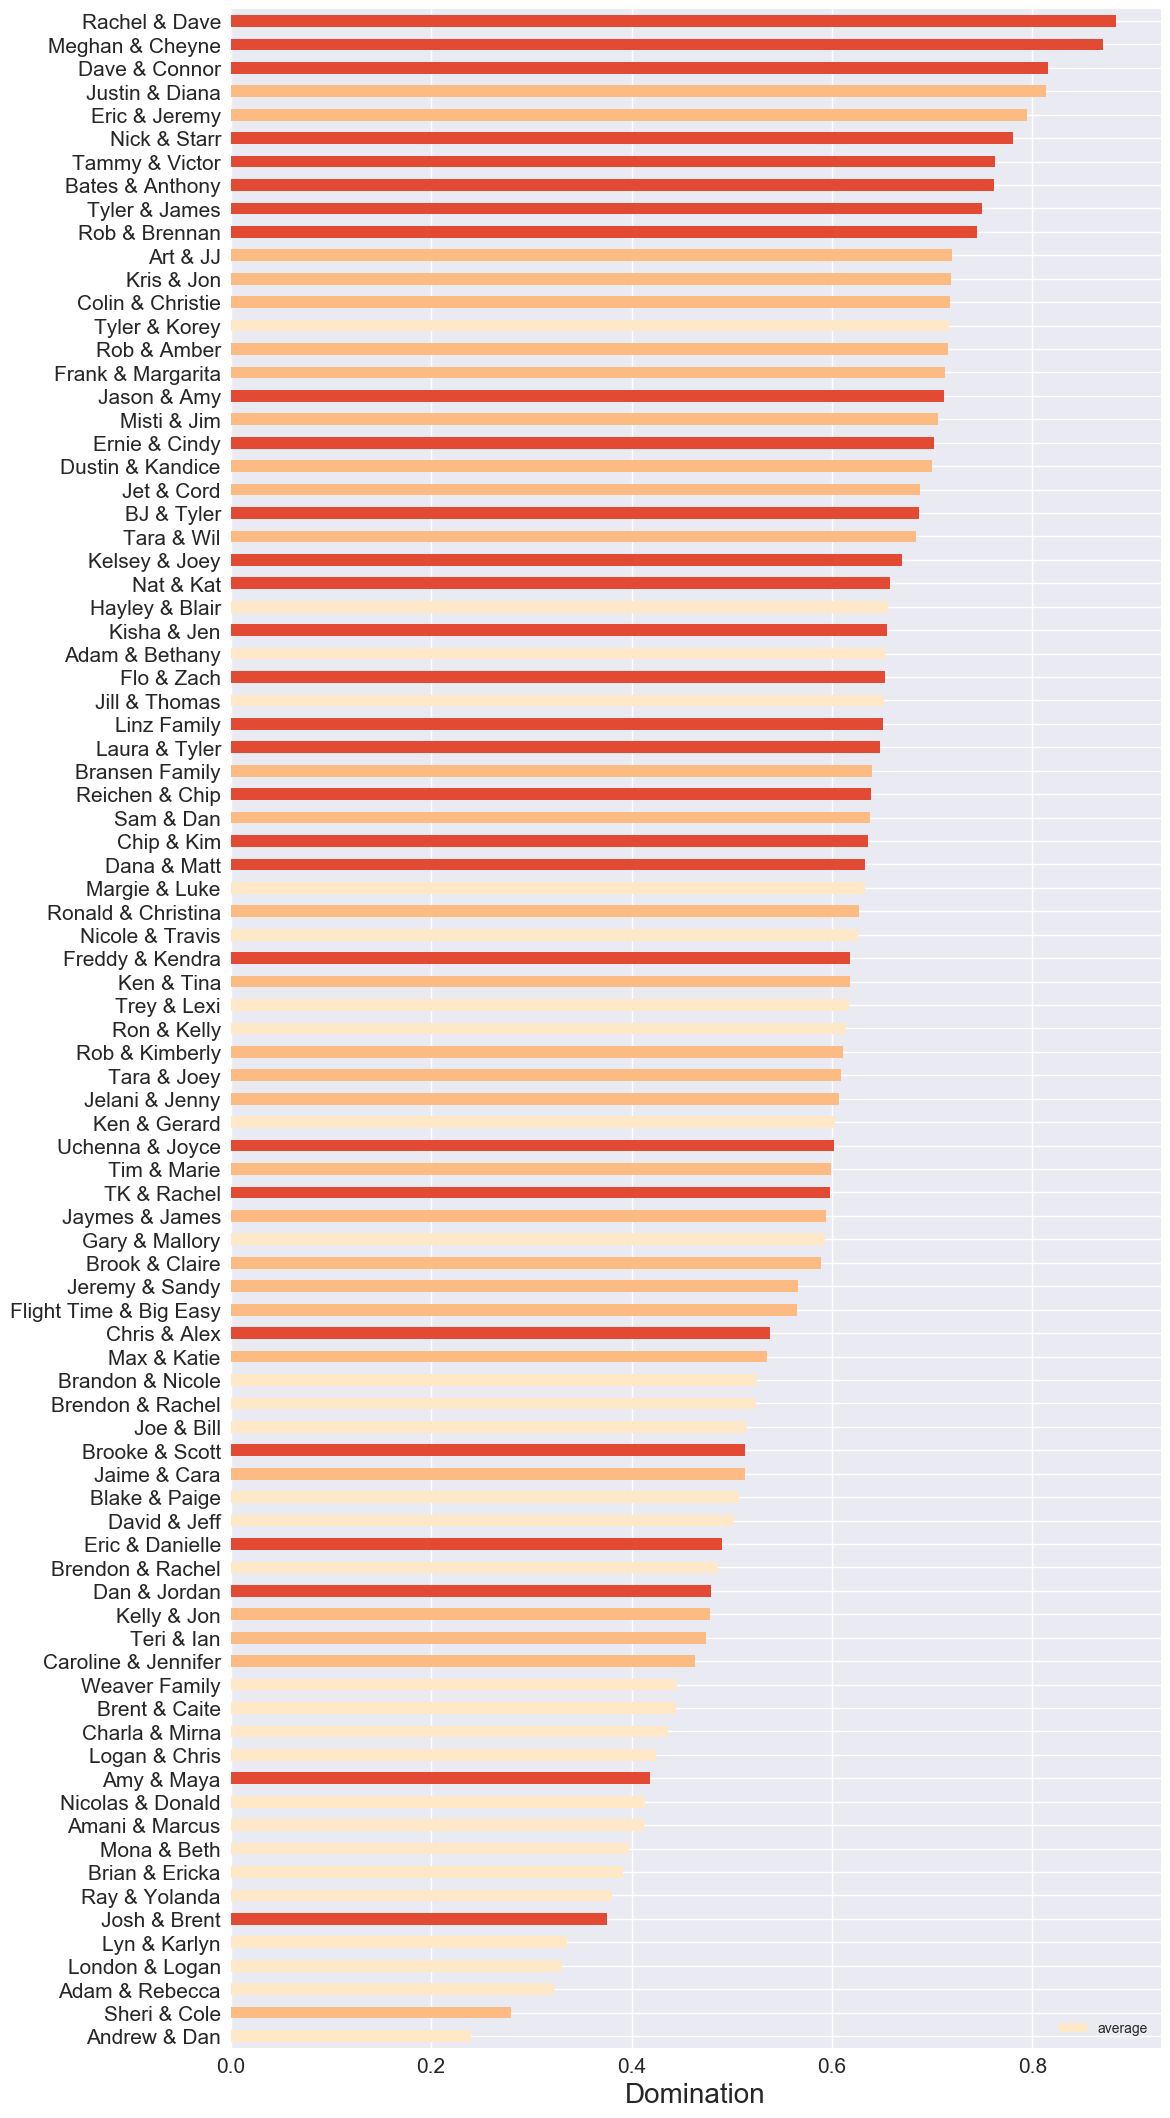
The top three still remains the same if we include the second and third placers. However, the fourth and fifth spots occupied by Nick and Starr and Tammy and Victor are transferred to second placers Justin and Diana and Erik and Jeremy. The two teams undoubtedly dominated their respective seasons, only coming up short on the final leg. Justin and Diana actually surpass the 0.8 domination level, the only non-winner to do so.
Amy and Maya and Josh and Brent, the two least dominant winners, actually get surpassed by a number of third-place finishers.
On the opposite side, Tyler and Korey actually managed to crack the Top 14 most dominant finalists even if they only finished third.
Looking at the low scorers, we see that the bottom five teams all are way below the 0.4 domination level, and all are third place finishers except for Sheri and Cole.
Tightest Finales
Let’s shift our focus a bit by answering another interesting question. What was the tightest last leg in terms of racing skill of the final three teams?
To answer this question, for each season, we calculate the domination indices of the top three teams on the pre-final leg. We look at the largest index and the smallest index and get the difference of the two to get the domination range.
Intuitively, the domination range is the average fraction of racers between the best performing and worst performing teams in the final three during the race. That is, a domination range of 0.20 means that the best and worst teams in the final three are, on average, separated only by 20% of the other teams during the race.
Thus, the season with the tightest finale in terms of skill is one with a low domination range. Analogously, a season with very strong and very weak teams has a high domination range.
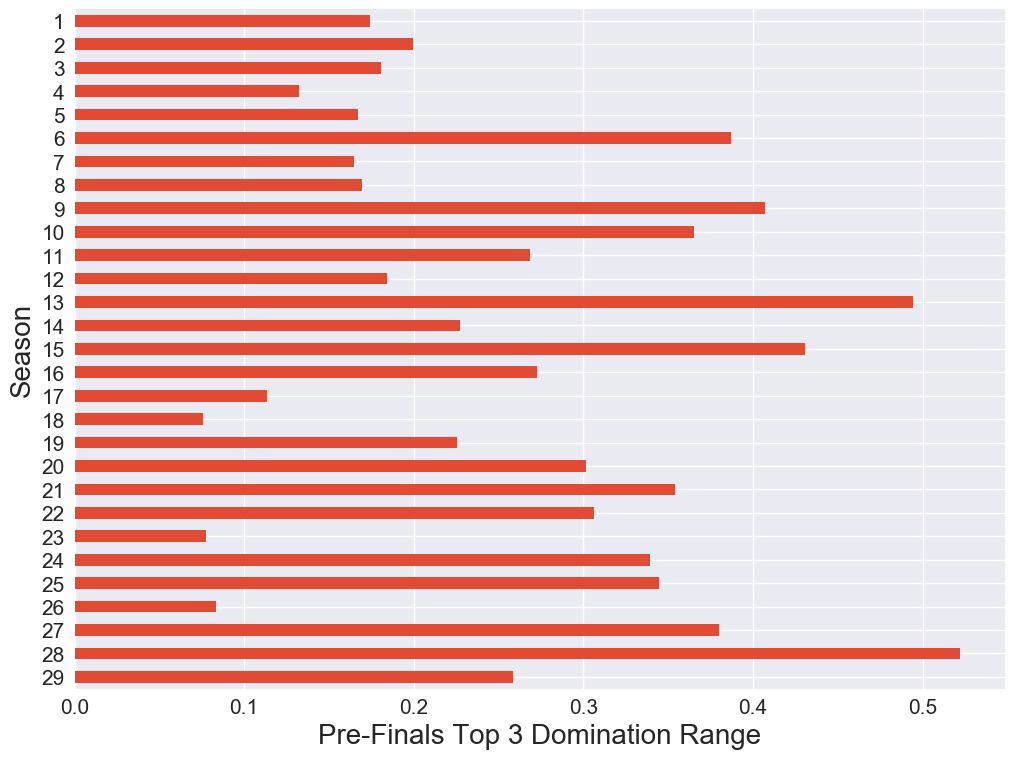
We can see here that Seasons 18, 23 and 26 have the lowest domination ranges, and thus have the tightest final legs in terms of skill of racers. The final three racers in these seasons were all quite evenly matched. All three of these seasons have domination indices less than 0.1, meaning only 10% of the other racers separated the best and worst teams in the final three.
Seasons 13 and 28 have the highest domination ranges. In Season 13, this is because of the presence of a very dominant team, Nick and Starr, and a very weak team, Andrew and Dan. In this scenario, the dominant team won. In Season 28, Tyler and Korey took up the role as the dominant team while Sheri and Cole were the weak team. Dana and Matt, another underdog team like Sheri and Cole, won while Tyler and Korey settled for third..
Top 50 Most Dominant Teams
Let’s segue back to looking at the most dominant teams. But now, let’s remove the restriction that the team must have reached the final leg — let’s look at all the 300+ racers from seasons 1 to 29. Again, the darker the shade, the higher the placement.
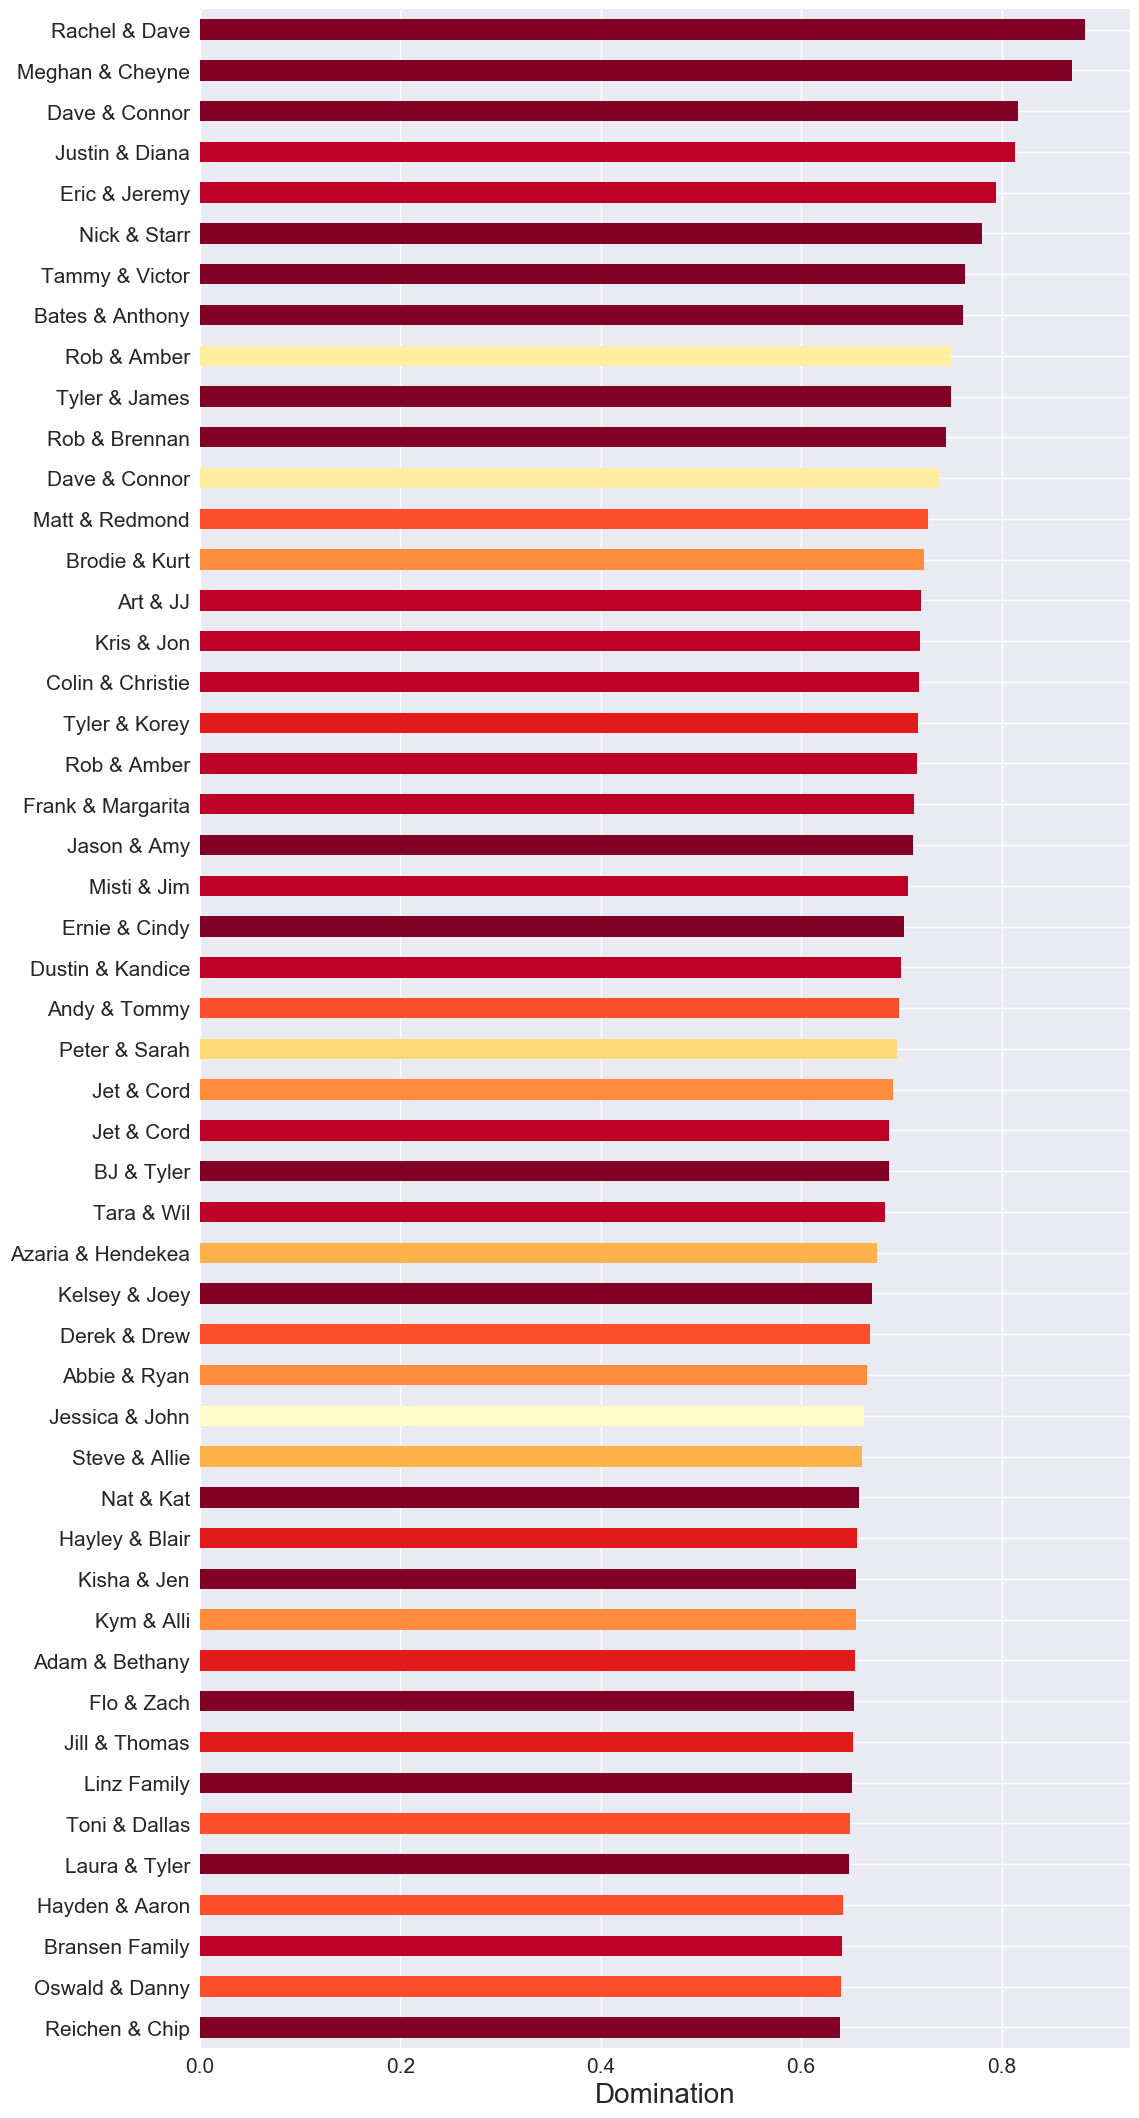
The top 50 teams all have domination index greater than 0.6, meaning that they placed above 60% of their respective competitors during the time they were in the race.
The top five remains the same, but now Tyler and James are displaced by Rob and Amber (All Stars) in the top 9 spot. Rob and Amber placed 8th in the race, but also placed 1st in the three legs prior to their elimination leg, which led to their high domination index. Similarly, Jessica and John performed really, really well in the first three legs, but were eliminated at 9th on the fourth leg.
To summarize, we can safely say that the top four teams in terms of domination are
- Rachel and Dave,
- Meghan and Cheyne,
- Dave and Connor,
- Justin and Diana.
If you’re interested to see how to do the scraping and calculations, check out my Github.