
The TV show Survivor has been the subject of countless thought pieces. One analyzed the portrayal of women in the show, while another looked at the psychology of jury votes. However, one thing I noticed is that all of the articles I’ve seen approached the show from a qualitative perspective. I believe that there is some benefit in using a computational perspective, and this is what I’ll be doing in this blog post.
Relationships are the most important element to survive in Survivor. Relationships lead to alliances and alliances lead to voting patterns. The question is, can we go backwards?
Scraping the Survivor Wiki
Analysis will not be possible without data. In this section, I describe the web scraping process using the Python module Beautiful Soup. Specifically, the data I’ll be fetching is the voting history table from each season page in the Survivor Wiki.
What is Web Scraping?
Web scraping is the process of extracting data from websites. Since websites are basically HTML documents underneath (with added bells and whistles from CSS and JavaScript), web scraping usually involves parsing the HTML document for the data you want. You can easily see the underlying HTML of any site using tools form your browser. For example, in Chrome, you can right-click and select View Page Source from the options that appear.
Scraping is quite a sensitive topic to talk about since it’s in the legal grey area. Note, however, that the content of the Survivor Wiki is under the CC-BY-SA license and can be used for this analysis.
To be proficient in web scraping, you must first have some understanding of the structure of an HTML document. In a nutshell, each HTML document can be thought of as a tree with nodes connected to branches. Each node is an object which represents a part of the document (or a feature of the website). Each node branches from a parent node (unless it’s the root node) and then branch off into child nodes (unless it’s the terminal node). Elements in the tree can be accessed using the programming API known as the Document Object Model (or the DOM). You can read more about the DOM on Wikipedia.
Let’s take this simple HTML document, for example.
<!DOCTYPE html>
<html>
<head>
	<title>My webpage</title>
</head>
<body>
	<h1>A simple webpage</h1>
	<p >This is so lovely</p>
	<p class='comment'>Great!</p>
</body>
</html>
Opening this up in Google Chrome, this gets rendered as:
Looking at the HTML file, you can see items surrounded by < >. These are tags – the basic elements of an HTML file. The first tag simply tells your browser that the file is an HTML file, and should be interpreted as such. The second tag is the root of the file, and basically says that all tags below it are part of the HTML and should be read. Often, tags appear in pairs, but there are some tags as well which appear only once, for example a line break tag </br>.
As I’ve said earlier, HTML can be interpreted as a tree. The reason why tags often appear in pairs is that this allows them to contain other elements. Notice that the html tag branches off into the head and body tags. The first contains meta-data related to the file, including the title of the HTML page, and the second contains the elements which are actually rendered in the webpage.
Notice that the body contains two tags, h1 and p. The h1 tag is a header tag, which is basically a heading in the webpage. The p tag is a paragraph tag, which contains a block of text. In the second tag, you can see that there is another attribute that is included – a class. A class is an identifier for the tag, which you can use to access it, for example, when you want to manipulate its appearance using CSS. The important things to note about a class is that more than one tag can have the same class, and a tag can have more than one class. If the tag has more than one class, the classes are separated by a whitespace. There is also another type of identifier, an id, which is the unique identifier of a tag.
All these tags can be accessed using the Document Object Model, as mentioned earlier.
Obviously, webpages on the Internet have way more complicated HTML than the one I’ve shown above. A simple check of the HTML code of this page proves this point. It becomes apparent that web scraping isn’t a very trivial matter.
Web Scraping with Beautiful Soup
Enter Beautiful Soup – a Python module which makes web scraping a very simple affair. It provides a very simple interface to perform web scraping – you can do a lot of complicated things with only a few lines of code. I’ll provide a very short introduction on how to access information from webpages using Beautiful Soup, but if you want to learn more, the documentation can be accessed here.
Let’s assume that you already have the HTML document stored as a string in a variable called html_doc. However, if you only have the url of the website that you wish to scrape, you can use the requests module to extract the HTML. The way to do it is to call requests.get(target_url), where target_url is the url of the webpage you want to scrape, and assign the output to some variable, say request_object. To obtain the HTML as a string and save it to html_doc, assign request_object.content to html_doc. Simple, right? That’s the power of Python.
Next, you have to convert the HTML string into a Beautiful Soup object, say bs_object, which you can query for tags. The way to do this is to set BeautifulSoup(html_doc) to bs_object. From this object, you can now query for tags and the information that they contain.
There are a number of methods you can call on the Beautiful Soup object to query for the tags that you want. I’ll be focusing on three: .find(), .find_all(), and .select().
The .find() method accepts as input a number of things – a tag, a class, or an id. The input identifies the tag that you want. Note that my discussion is very much simplified – the .find() method is really powerful. You can actually even query tags using their attributes, for example, their style attribute, if they have one.
It’s entirely possible that your identifier matches a lot of tags in the HTML, but .find() only returns the first one it finds. The .find_all() method, on the other hand, returns all tags which match the input identifier.
Lastly, if you’re well-versed in CSS, you can use a CSS selector as an identifier using the .select() method. The .select() method can also be used if you want to look for tags which have two or more classes. For example, if you want to get the tags which have class = “class_1 class_2”, you can use .select(“p.class_1.class_2”) on the Beautiful Soup object.
I’m just scratching the surface here. If you’re interested, read more about Beautiful Soup here.
Scraping the Survivor Wiki
Now that you’re acquainted with scraping in Beautiful Soup, let’s try to extract the voting history data from the Survivor Wiki Caramoan page. The main objective is to copy the contents of the table to a Pandas dataframe. This allows for easy data manipulation.
I will save you all the effort of looking at the HTML of the wiki page. Let me just give the essential observations on the structure of the table.
- The voting history table is the last table tag with class
table.wikitable.article-table. - The
trtags which contain a single td tag with styletext-align: left;are the rows of the voting history table. - The name of the voter is enclosed in a
tdtag with styletext-align: left;ortext-align: left; white-space: nowrap;‘. - The other
tdtags in the contain the contestants the voter voted for during the tribal councils he was present in, or-if he was not present. These tags can be accessed by callingfind_next_siblings()on the tag in 3.
Using these four observations, you will be able to parse the HTML document for the votes of each contestant. Note that I will take a simplified approach and consider all votes cast, including those cancelled by a hidden immunity idol or votes resulting in a tie. Each casted vote is included in the resulting Pandas dataframe.
I wrote a function called extract_voting_table_as_df(link) to extract the voting table from the wiki link. Note that some cells span more than one column, particularly those votes which result in a tie, so I had to compensate for it in the resulting data frame.
from bs4 import BeautifulSoup
import requests
import pandas as pd

def turn_to_url(season):
    return 'http://survivor.wikia.com/wiki/Survivor:_' + season.replace(' ','_')

def process(string):
    stripped = string.strip()
    return re.sub('[0-9]+', '', stripped)

def extract_voting_table_as_df(link):
    """
    Extract the voting history table as a pandas data frame.
    Input: link - url for the season page in Survivor wiki
    Output: dd - pandas dataframe of the voting history table
    """
    cara = requests.get(link)
    soup = BeautifulSoup(cara.content, 'lxml')

    # use select() bec 2 css classes
    voting_table = soup.select('table.wikitable.article-table')[-1]
    # obtain the table cells of the voters (the leftmost column)
    names = voting_table.find_all('td', style = 'text-align: left;')
    names.extend(voting_table.find_all('td', style = 'text-align: left; white-space: nowrap;'))

    # obtain the names of the voters as strings
    contestants = []
    for voter in names:
        contestants.append(process(voter.text))

    no_vote = ['Quit', 'Evacuated']
    # we will convert this list into a pandas df
    season_list = []

    for voter in names:
        voter_dict = {'Name' : process(voter.text)}
        inc = 0
        for voted in voter.find_next_siblings():
            if process(voted.text) in ['Jury Vote','']:
                break
            # some cell span more than one column
            # compensate for this by adding more '—'
            if voted.has_attr('colspan'):
                numcol = int(voted['colspan'])
                for i in range(numcol):
                    voter_dict[inc] = '—'
                    inc += 1
                continue

            if (process(voted.text) in contestants) or (process(voted.text) == '—') or (process(voted.text) in no_vote):
                voter_dict[inc] = process(voted.text)
            inc += 1
        season_list.append(voter_dict)
    #print(season_list)

    # convert the list into a pd data frame and set as index the voters
    dd = pd.DataFrame(season_list).set_index('Name')
    # rearrange the columns of the data frame in increasing order
    dd = dd[sorted(dd.columns)]

    # remove columns which represent no voting: evacuated or quit
    del_cols = []
    for i in dd.columns:
        if ('Evacuated' in dd[i].values) or ('Quit' in dd[i].values):
            del_cols.append(i)
            continue
        for ind,j in enumerate(dd[i].values):
            if j in contestants:
                break
            if ind==len(dd[i])-1:
                del_cols.append(i)
    dd=dd.drop(del_cols,axis=1)

    return dd

seasons = ['Borneo', 'The Australian Outback', 'Africa', 'Marquesas', 'Thailand', 'The Amazon',
           'Pearl Islands', 'All-Stars', 'Vanuatu', 'Palau', 'Guatemala', 'Panama',
           'Cook Islands', 'Fiji', 'China', 'Micronesia', 'Gabon', 'Tocantins', 'Samoa',
           'Heroes vs. Villains', 'Nicaragua', 'Redemption Island', 'South Pacific',
           'One World', 'Philippines', 'Caramoan', 'Cagayan', 'San Juan del Sur',
           'Worlds Apart', 'Cambodia', 'Kaôh Rōng', 'Millennials vs. Gen X',
           'Game Changers']

caramoan = extract_voting_table_as_df(turn_to_url(season[-8]))
Hopefully, with the introduction to HTML and Beautiful Soup that I’ve given above, you are able to understand the script in its entirety.
The resulting data frame object for Caramoan looks like:
You may notice certain weird things from the data frame since I made three simplifications.
-
The columns in the data frame represent voting rounds, not tribal councils. We define a voting round to be an instance wherein castaways vote. Whenever a tribal council ends in a tie, a re-vote is done. This means that a single tribal council can have two or more voting rounds, depending on if ties occur. There are also times when someone gets eliminated but doesn’t leave via tribal council. For example, when a castaway gets sick and has to be evacuated, or when a castaway simply gives up and quits the game. These eliminations are not considered.
-
Cancelled votes are still counted. Since cancelled votes are still indicators of the castaways’ relationships, they should still be considered in the analysis.
-
Jury votes are not considered.
Mathematics of Survivor Alliances
Now that I have some data to play with, I can now spend time to discuss the conceptual framework of how we model alliances, and also address a gameplay tactic employed frequently - vote splitting.
Voting Together
When two castaways vote to eliminate the same person, the two are usually in an alliance. To represent relationships such as these, we introduce a simple affiliation index between each pair of castaways present in a voting round. This affiliation index can be either 1 or 0: 1 if the pair voted together, and 0 if the pair did not.
To fix notation, let us consider contestants i and j at voting round t. The affiliation index of the two at time t is written as
You may notice that the wording voted together is a bit vague. How can we tell if the pair of castaways voted together?
The most obvious case is when the pair of castaways voted to eliminate the same person.
However, this does not take into account a common strategy employed by a majority alliance to pick off minority members: vote splitting.
Sometimes, the majority alliance is in a position comfortable enough that they are able to split the votes between two minority members.
Why would they do that? To nullify the hidden immunity idol of the minority member, in the situation that he has one and feels unsafe in his position.
Addressing Vote Splitting
To recognize a split vote, we have to look at the vote of everyone, including the targets. Usually, there are more than two names in the ballots during a split vote – the two targets of the majority alliance and the targets (one or more) of the minority.
I thought of an algorithm that scans through each target and looks if whether two targets vote the same way (my algorithm is more general, as I’ll explain later). If the two targets have the same vote, then the castaways who voted for the two targets are considered to be in an alliance.
… That still sounds really confusing, so I’ll illustrate with an example.

Think back on the Andrea boot in Survivor Caramoan. Here, Cochran, Dawn, Sheri, Erik, and Brenda split their votes between Eddie and Andrea. On the other hand, Eddie and Andrea voted for Brenda.
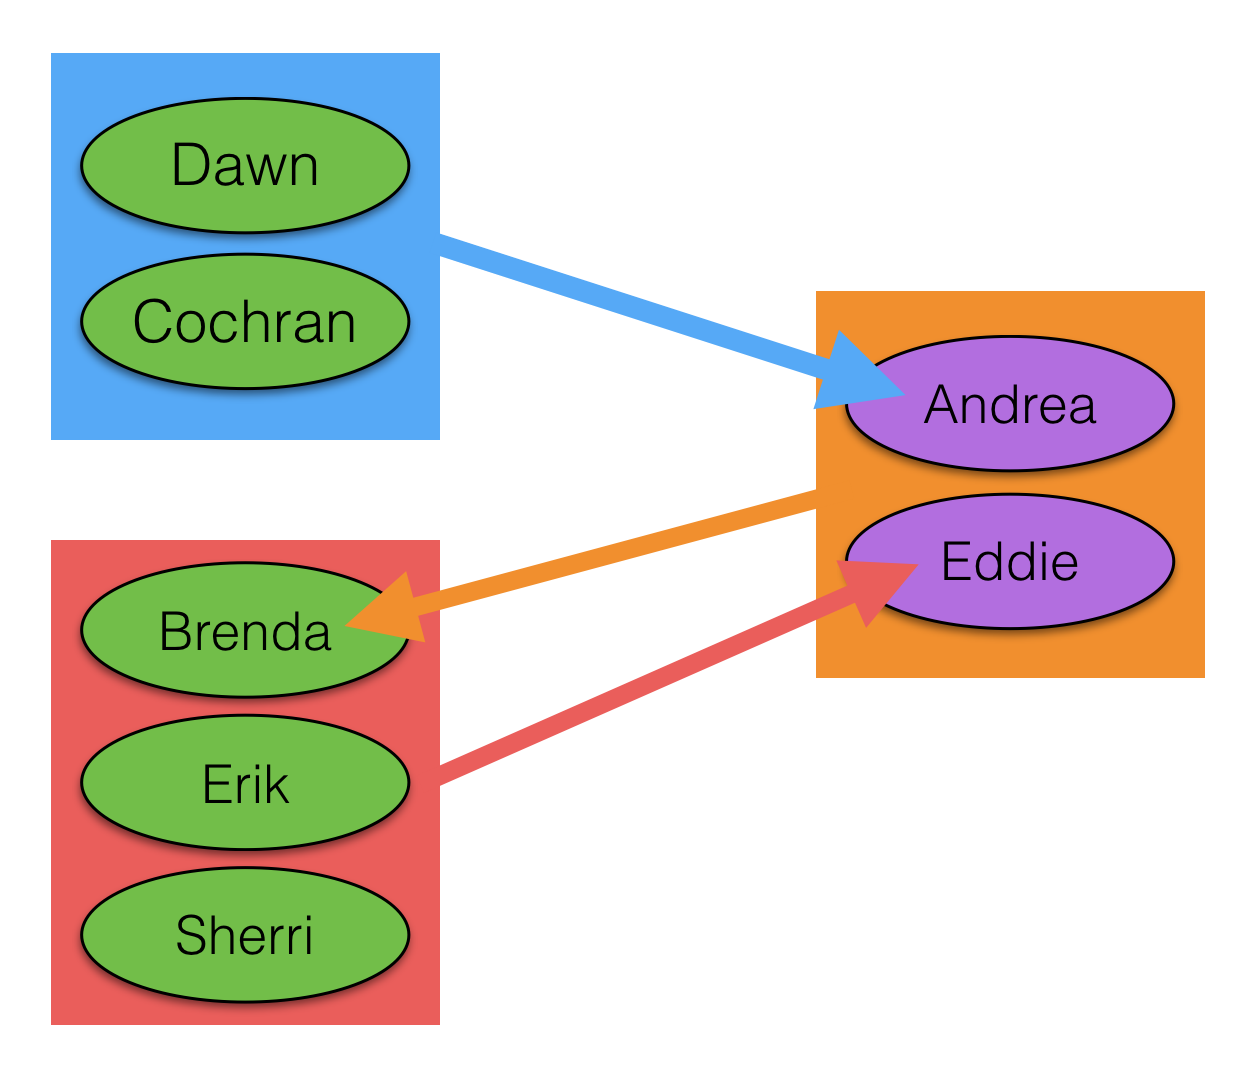
Now, since Eddie and Andrea voted for the same person, we can consider the pair to be in an alliance, albeit a minority one. Not only that, we can conclude further that Cochran, Dawn, Sheri, Erik and Brenda are in an alliance as well even though some voted for Eddie and some voted for Andrea, since Eddie and Andrea targeted the same person within their group.
My algorithm recognizes this type of scenario. Actually, it’s more general – Andrea and Eddie don’t have to vote for the same person, they can vote for two people as long as these two people vote for either Andrea or Eddie alone. My algorithm doesn’t cover all cases since voting patterns can be quite complex. But as a first approximation, it works quite well.
Hence, each pair in [Cochran, Dawn, Sheri, Erik, Brenda] will have affiliation index equal to 1 in the Andrea-boot voting round, and the pair Eddie-Andrea will have value 1 as well. All other pairs will have 0.
If we collect the affiliation indices for each pair of castaways for each voting round, we will be able to construct an affiliation table where each row is a castaway pair and each column is a voting round. Each entry in the data frame will either be a 1, 0, or Null. The latter will happen if the castaway pair did not attend the voting round together.
The implementation of the algorithm can be found here. It’s quite long, so I didn’t include it in the post.
Relationship Dynamics
We now have some vague way to deduce from voting patterns who voted together during each voting round. However, what we actually want to analyze is the dynamics of the castaways’ relationships over the course of the season, not just individual voting rounds.
We can use the affiliation index to define a quantity, the alliance index, to see how relationships change over time.
Suppose that we have two contestants i and j at voting round t. The alliance index is defined as
where vot(i,j) is the number of voting rounds that i and j attended together. Basically, the alliance index is the average of contestant i and j’s affiliation index up to the voting round t.
For intuition, let’s introduce two hypothetical castaways, Linda and Ty. Suppose that voting round 7 just ended and that prior to round 7, Linda and Ty experienced 5 voting rounds together. Suppose that their alliance index currently sits at 0.80. This means that during the 5 voting rounds they attended together, they voted together 80% of the time (or 4 out of 5 voting rounds).
We can calculate the alliance index of a castaway pair using the following script. Here, series refers to a row in the affiliation table.
def calculate_alliance_index(series):
    """
        Calculate the alliance index which is defined as:
            alliance((i,j),t) = (1/t_{i,j})*sum_0^t(affiliation((i,j))
        where (i,j) is a contestant pair and t is the voting round and t_{i,j} is the
        number of times (i,j) appeared at voting round together

        input : series - pandas series
        output : alliance index series
    """
    series = series.dropna()
    out = []
    for i in range(len(series)):
        out.append(series[:i+1].mean())
    return pd.Series(out, index=series.index)
Ranking Each Castaway’s Top Relationships
As the number of voting rounds used to calculate the alliance index gets higher, the more information the alliance index contains. If we want to summarize a pair of castaway’s relationship over the whole season, we can calculate their alliance index up to the last voting round. If we do this for every pair of castaway, we can rank the resulting alliance indices and identify the top m relationships of each Survivor castaway.
However, there is one caveat. The more voting rounds that a pair of castaways attended together, the more confident we are that the alliance index is significant. Say, if Linda and Ty only experienced one voting round together, and if they actually voted together, then their alliance index would be 100%. If they experienced 10 voting rounds together, and voted together in all of these, then their alliance index would also be 100%. It’s apparent, however, that the alliance index in the second case is much more significant than the first, since their relationship has been tested a lot more.

For example, in the case of Millennials vs. Gen X, Adam-Mari would register an alliance index of 1.0, since they both voted for Figgy in Mari’s one and only tribal council.

However, we would expect Adam-Hannah to rank better than Adam-Mari, even though Adam and Hannah voted differently in the first tribal, since we are considering the season as a whole.
We can get around this issue by using the number of voting rounds together (let’s call this k) as a filter.
Consider again our hypothetical castaway Linda. Let’s fix k=5. What we mean by that is we scan all other castaways and consider only those who have attended 5 or more voting rounds with Linda. From those that remain, we select the m that have the highest final alliance index with Linda. In our Millennials vs. Gen X example, the Adam-Mari pair won’t be considered since Adam and Mari only attended one voting round together.
Visualizing the Alliance Index
The best way to see the dynamics of the alliance index is to fix a contestant and plot his alliance index with other castaways as a time series over voting rounds. The following code plots the top m relationships (with a filter k) for each castaway in a specified season.
def find_str(tup,string):
    return (tup[0] == string) or (tup[1] == string)

def simplify(tup, selected):
    if selected == tup[0]:
        return tup[1]
    else:
        return tup[0]

def plot_contestant_top_with_filter(dd, selected, season_name, m=5, k=5):
    """
        Plot top m contestants in terms of alliance_index with selected
        input:
            dd - data frame of voting table
            selected - contestant that you are focusing on
            m - top contestants to consider
            k - filter for number of voting rounds
    """
    filtered = return_alliance_df_with_filter(dd, k)
    with_selected = filtered[[find_str(i,selected) for i in filtered.index]].sort_values(len(filtered.columns)-1,ascending=False)
    top_m = with_selected.ix[:m]
    top_m = top_m.reset_index()
    top_m['index'] = top_m['index'].apply(simplify,args=(selected,))
    top_m = top_m.set_index('index')
    if len(top_m.index) != 0:
        top_m.T.plot(style='o-', ms=8).legend(loc='center left', bbox_to_anchor=(1, 0.5))
    plt.title("{}'s top {} relationships (>{} voting rounds together)".format(selected, m, k))
    plt.ylabel('Alliance index')
    plt.xlabel('Voting round $t$')
    plt.xticks(list(top_m.columns))
    plt.yticks(np.arange(0,1.1,.1))
    plt.xlim(-1,len(top_m.columns))
    plt.ylim(-0.1,1.1)
    fig = plt.gcf()
    fig.set_size_inches(12, 6)
    plt.savefig('{}_{}.png'.format(season_name, selected), bbox_inches='tight')
    plt.close()
The alliance index of a castaway pair can either increase, stay constant, or decrease in each succeeding voting round. When the alliance index increases, we can think of the castaway pair’s relationship strengthening (since they voted together). If it is stays constant, then either they didn’t attend the voting round together, or one of them got voted out already. If it decreases, then the castaway pair didn’t vote together in the voting round. In this case, we can think of it as their relationship weakening.
Case Study: Survivor Millennials vs. Gen X
To demonstrate, let’s take a look at the top 5 relationships of each castaway in Survivor Millennials vs. Gen X’s Final 10. To get significant alliance indices, let’s set our minimum number of voting rounds together filter to 5.
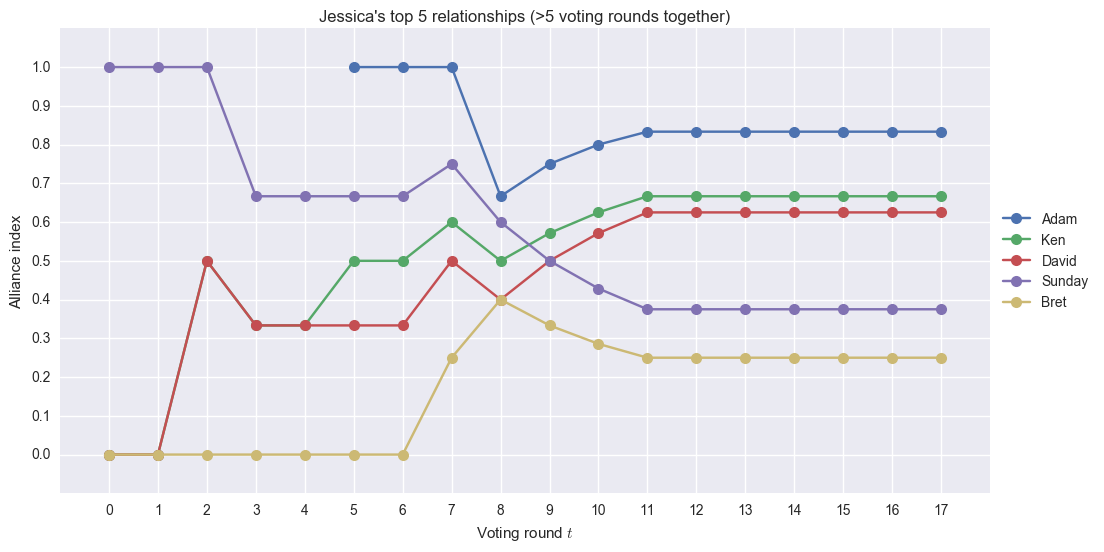
Four of Jessica’s top relationships are from the Gen X tribe, which is expected since she is a Gen X-er as well. Note that Sunday and Bret are unexpected here. She didn’t have a strong bond with the two of them, which is apparent from the plot trends. Initially, her alliance index with Sunday is high, since they voted together at the first council, but then it slowly decreases. Her alliance index with Bret, on the other hand, starts out low, increases a bit, and ends quite low.
We can also see here how Jessica’s relationship with David goes up, probably due to David using his hidden immunity idol to save Jessica. Her alliance index with Adam starts at voting round 5 when the tribe expansion took place. Then it decreases during the Taylor vote (which shouldn’t have been the case since they split the vote – my algorithm didn’t detect this since Jay and Taylor didn’t have the same target), and increases thereafter.
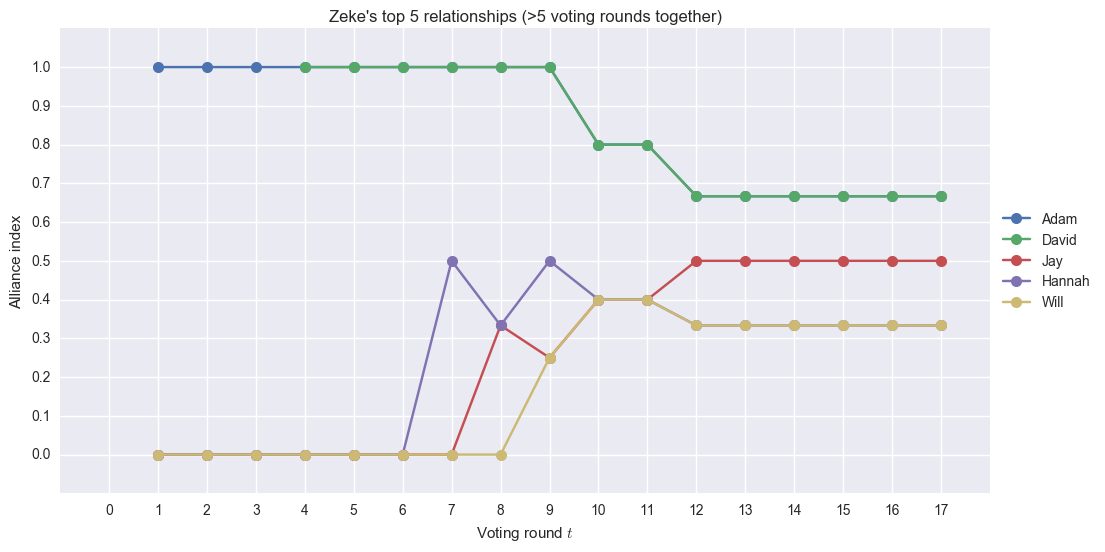
Adam and David tie as Zeke’s top relationship during the whole season (their plots overlap starting at voting round 4). They voted together in all the rounds until the Hannah-Zeke tie. Following the tie, Zeke’s relationship with the two went down. On the other hand, his relationship with Hannah, Jay, and Wil increased over the season.
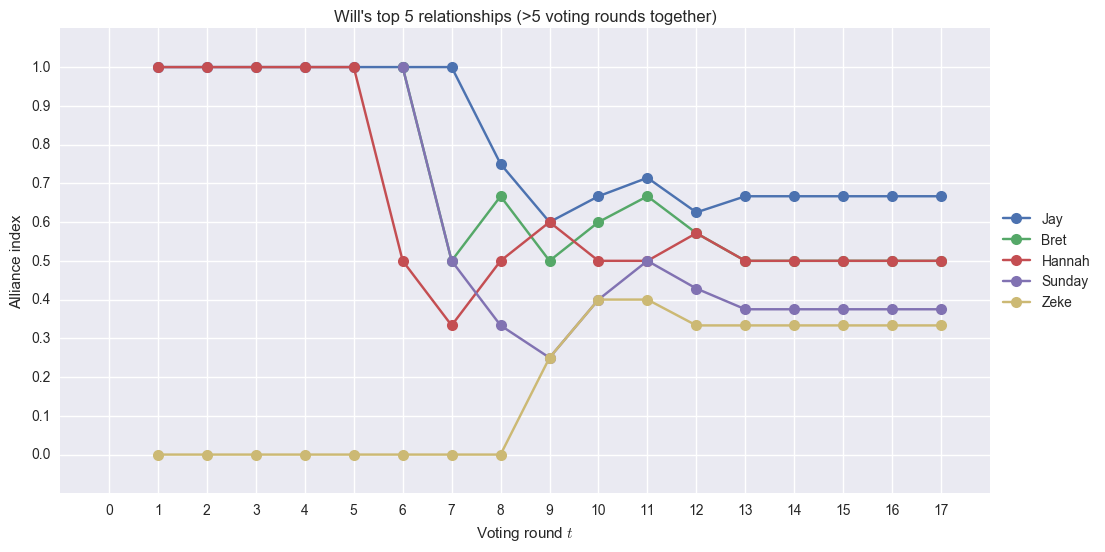
I forgot what happened with Wil. I think he was initially aligned with Hannah, Jay and the others in the Mari vote, explaining the high index. Eventually, he went with the Gen X-ers (Bret and Sunday) + Jay. But he flipped quite a number a number of times. I think the plot above tells an interesting story.
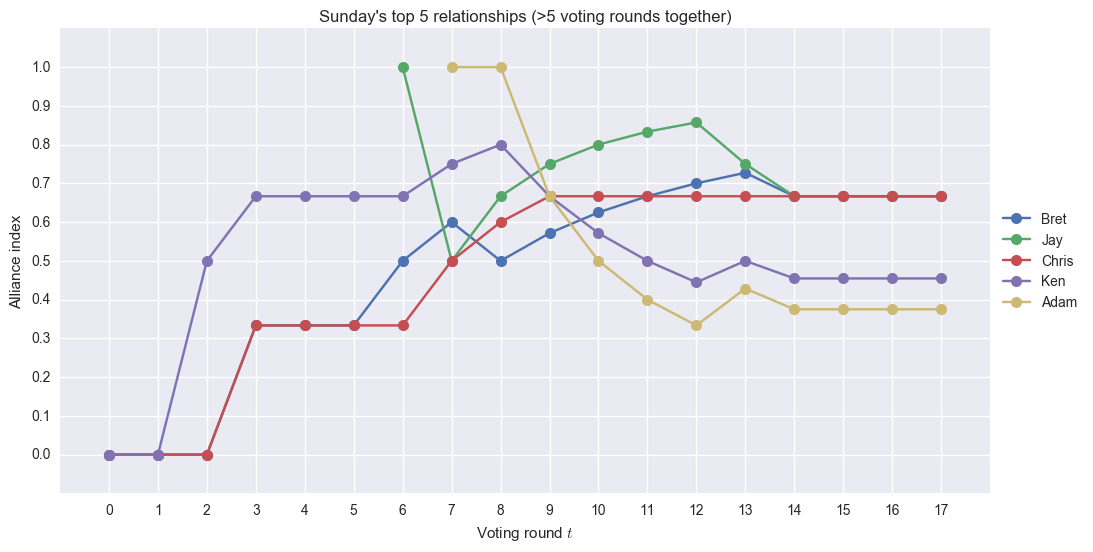
I think the algorithm detected Sunday’s top alliance members well. Bret, Jay, and Chris tie at the top 1 spot by the end of her Survivor run.computational analysis survivor alliances jay
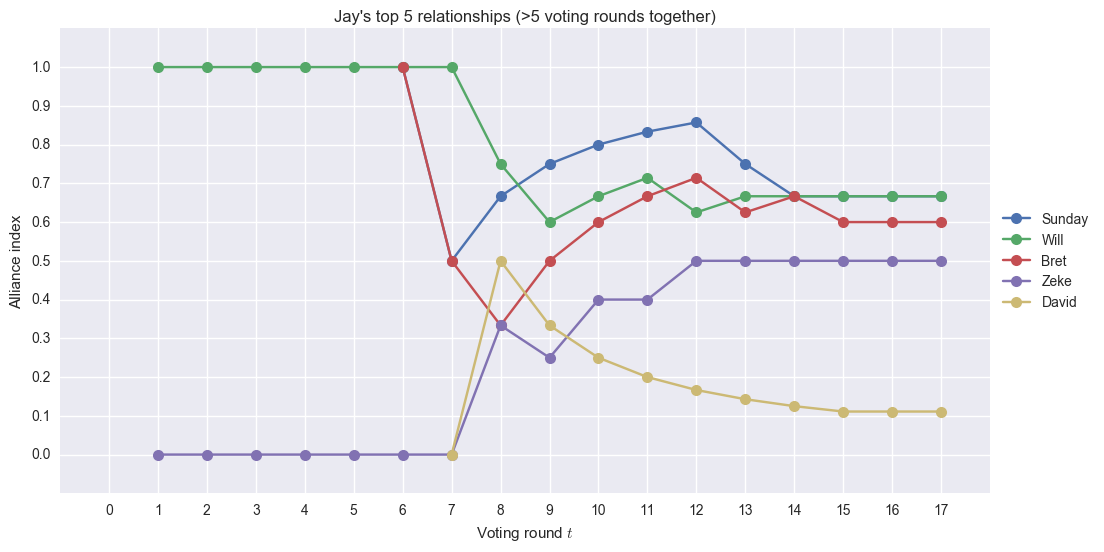
Sunday and Wil are at the top of Jay’s relationships. A close third is Bret. His relationship with Wil started high, but it went down since he flipped temporarily to Adam, then went back to voting with Jay.computational analysis survivor alliances bret
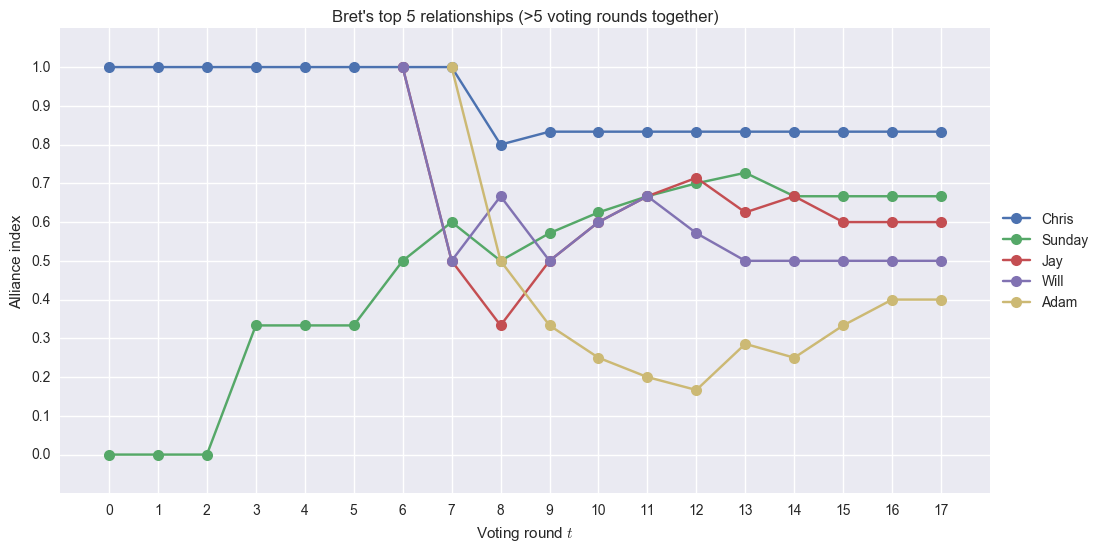
Ditto Brett.
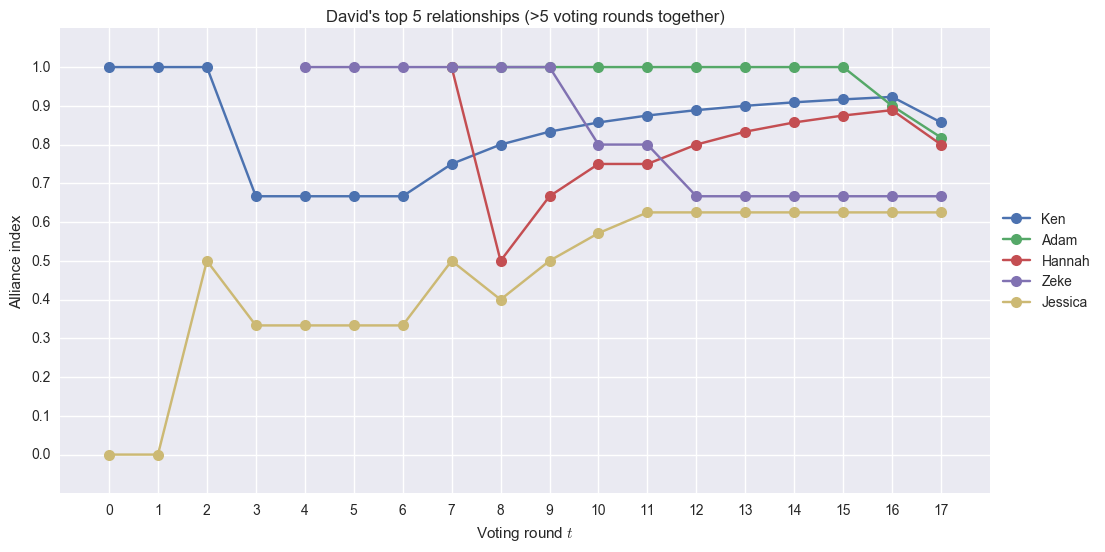
Unsurprisingly, Ken appears at the top of David’s ranking. Adam and Hannah follow. Starting round 15, Adam and David’s index started going down – this is the point wherein Adam started targeting David. Also, Jessica is at the 5th spot, even if David is at Jess’s 3rd spot in her ranking. (Personal opinion: I wanted David to win.)
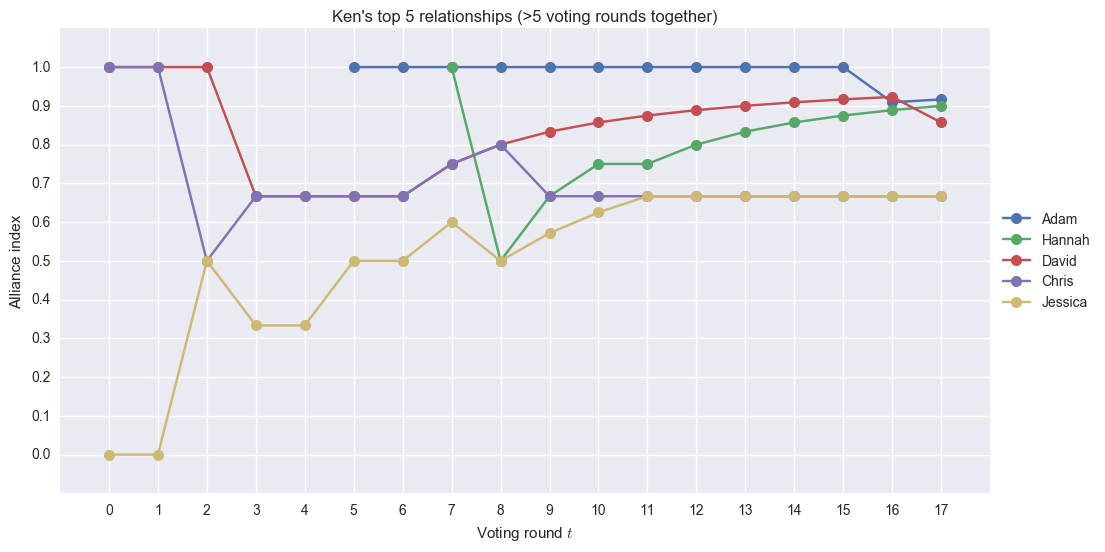
David would’ve been Ken’s top 1 if he didn’t vote for David at the last tribal council. Adam and Hannah are Ken’s top 2, which is expected since they have been in an alliance for a long time. We can see that over the course of the season, Ken’s relationship with Jessica developed.
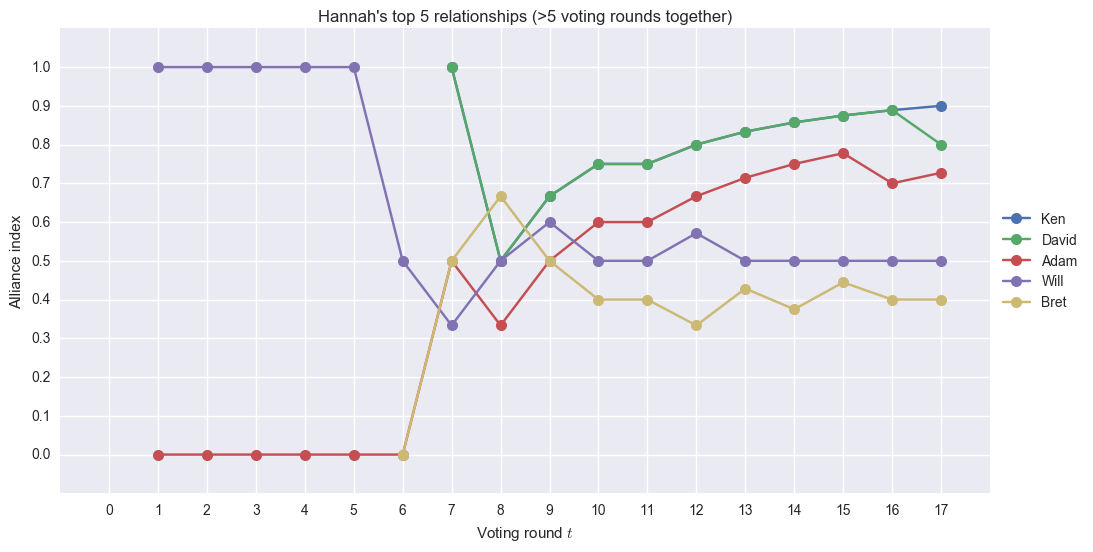
Ken, David, Adam are at the top, as expected. Wil and Bret also appear here, surprisingly. Starting voting round 8, Ken, David, and Adam’s indices with Hannah show an upward trajectory until the last vote when the group voted out David.computational analysis survivor alliances adam
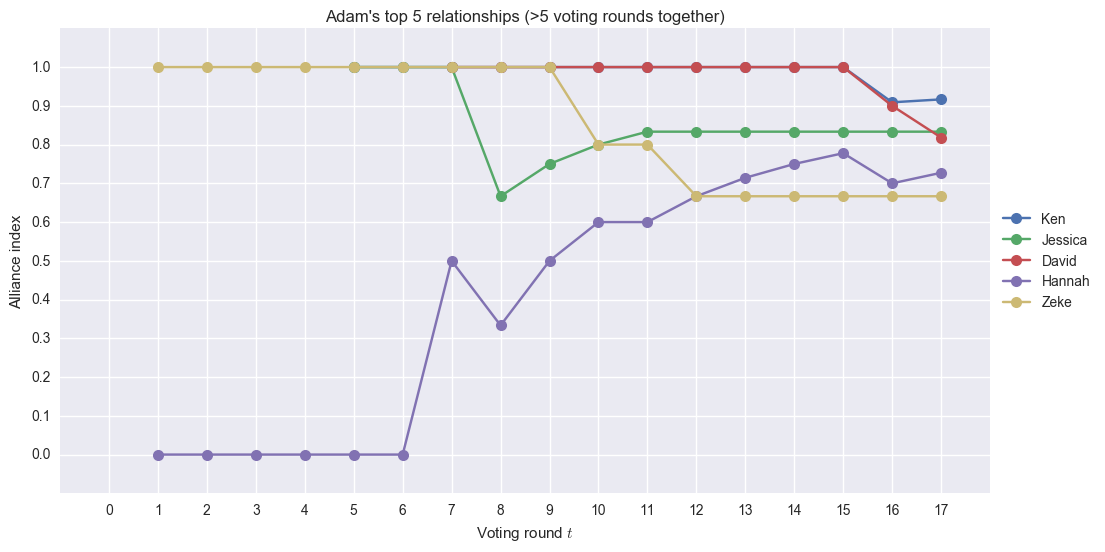
Adam’s plot is nice to look at because we can see which voting rounds he turned on his alliance. Starting voting round 10 (Hannah-Zeke vote), his index with Zeke started going down. Starting round 15 (David-Bret vote), his index with David started going down. We also see here that, initially, Hannah and Adam didn’t have a good relationship, but over the season grew significantly.
In Conclusion
The algorithm for detect castaways who are voting together isn’t perfect. There are a lot of complex scenarios that it doesn’t recognize. Further tweaking is necessary to obtain more accurate results.
The analysis done above is more descriptive than predictive. You can’t really look at the plots and say that in the next voting round, two castaways would turn on each other. Really, then, what’s the point of all of this?
One other way we can use the alliance index is to summarize the relationships in a season. We can try to summarize the relationships of the castaways in a single, neat network. The alliance index lends itself perfects to construct a Survivor Alliance Network. From this network, we will be able to see the interconnections of the castaways.
As always, code is up on Github.